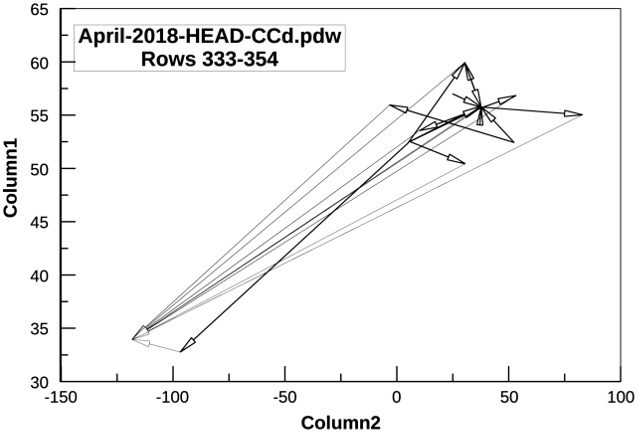
Vector
diagram
for rows 333 through 354
Column1 =
Latitude
Column2 = Longitude
(degrees)
|
Originating
Coordinates
|
Intermediary
Coordinates
|
Time
hh:mm:ss
|
|
|
| 52.5242 |
5.7272 |
50.4409 |
30.5272 |
18:47:55 |
| 52.3613 |
4.9151 |
32.7753 |
-96.8057 |
18:47:55 |
| 55.7616 |
37.6411 |
55.7616 |
37.6411 |
18:54:35 |
| 55.7616 |
37.6411 |
59.9390 |
30.3158 |
18:59:36 |
| 55.6008 |
37.5911 |
55.7616 |
37.6411 |
18:59:36 |
| 55.7616 |
37.6411 |
55.7616 |
37.6411 |
18:59:37 |
| 55.7616 |
37.6411 |
55.7616 |
37.6411 |
18:59:38 |
| 55.6950 |
37.6847 |
53.5534 |
10.0513 |
19:24:05 |
| 55.7762 |
37.4742 |
59.9390 |
30.3158 |
19:24:05 |
| 55.6950 |
37.6847 |
56.8498 |
53.2045 |
19:24:05 |
| 52.5200 |
5.7084 |
55.7616 |
37.6411 |
20:42:46 |
| 52.5242 |
5.7272 |
55.8406 |
37.4053 |
20:42:46 |
| 52.3783 |
4.9060 |
59.9390 |
30.3158 |
20:44:46 |
| 57.0000 |
25.0000 |
55.7616 |
37.6411 |
20:52:30 |
| 55.7616 |
37.6411 |
55.0392 |
82.9278 |
20:57:49 |
| 55.7696 |
37.6470 |
59.9390 |
30.3158 |
21:30:17 |
| 55.6950 |
37.6847 |
59.9390 |
30.3158 |
21:30:18 |
| 55.7762 |
37.4742 |
59.9390 |
30.3158 |
21:30:19 |
| 52.4317 |
52.3965 |
55.7616 |
37.6411 |
21:56:38 |
| 52.4317 |
52.3965 |
55.9579 |
-3.2034 |
21:56:38 |
| 59.9390 |
30.3158 |
59.9390 |
30.3158 |
21:56:38 |
| 59.9390 |
30.3158 |
55.7616 |
37.6411 |
21:56:38 |
|
|