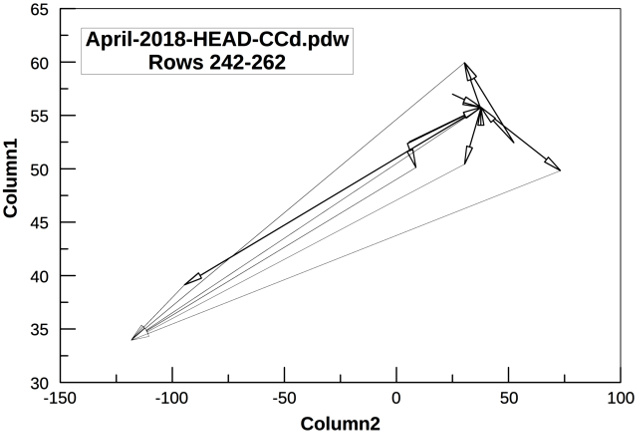
Vector
diagram
for rows 242 through 262
Column1 =
Latitude
Column2 = Longitude
(degrees)
|
Originating
Coordinates
|
Intermediary
Coordinates
|
Time
hh:mm:ss
|
|
|
| 55.7616 |
37.6411 |
55.7616 |
37.6411 |
07:45:50 |
| 55.7616 |
37.6411 |
55.7616 |
37.6411 |
08:20:24 |
| 55.7616 |
37.6411 |
55.7616 |
37.6411 |
08:20:24 |
| 55.6008 |
37.5911 |
59.9390 |
30.3158 |
08:21:18 |
| 55.7616 |
37.6411 |
55.7616 |
37.6411 |
08:26:38 |
| 55.7616 |
37.6411 |
55.7616 |
37.6411 |
08:26:40 |
| 52.5200 |
5.7084 |
55.7616 |
37.6411 |
08:27:07 |
| 52.3783 |
4.9060 |
55.7616 |
37.6411 |
08:27:07 |
| 52.5242 |
5.7272 |
55.7616 |
37.6411 |
08:42:34 |
| 55.6950 |
37.6847 |
50.4398 |
30.4126 |
08:44:23 |
| 55.7696 |
37.6470 |
39.1478 |
-94.5689 |
08:44:23 |
| 55.7762 |
37.4742 |
55.7616 |
37.6411 |
08:44:23 |
| 55.6950 |
37.6847 |
49.8333 |
73.1667 |
08:44:23 |
| 55.6950 |
37.6847 |
55.7616 |
37.6411 |
08:44:24 |
| 57.0000 |
25.0000 |
55.7616 |
37.6411 |
08:45:09 |
| 52.4317 |
52.3965 |
59.9390 |
30.3158 |
08:49:30 |
| 59.9390 |
30.3158 |
59.9390 |
30.3158 |
08:49:30 |
| 59.9390 |
30.3158 |
59.9390 |
30.3158 |
08:49:30 |
| 52.4317 |
52.3965 |
55.7616 |
37.6411 |
08:49:31 |
| 52.5242 |
5.7272 |
55.7616 |
37.6411 |
08:56:58 |
| 52.3613 |
4.9151 |
50.1221 |
8.6658 |
08:56:59 |
|
|